|
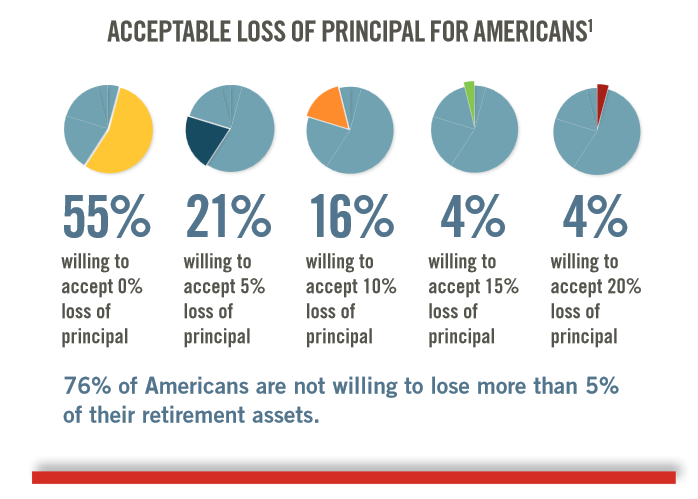
While title of this post "Acceptable Loss" sounds like a giant oxymoron similar to "rolling-stop" or "half-dead" I can assure you there is true meaning behind it. Recently I was looking over an article published by WealthVest that talked about the top three fears among retirees that they surveyed. These three fears were: Investment risk, Longevity risk, and Market valuations. Looking at the first which is the most intuitive: Investment risk. Over the past 15 years traditional investors have battled with two severe bear markets. Its no wonder after suffering from a 50% haircut in your account value (twice) that people would be a little hesitant to take on unneeded investment risk. Statistically speaking 77% of Americans are less comfortable with investment risk today than they were 10 years ago, according to the WealthVest survey. Look at the graphic below as it relates to per-retirees and active retirees tolerance for loss. To clarify in this example we are talking about decline in portfolio value, which doesn't specifically mean a realized loss from selling. Using the data above, a whopping 76% of these survey respondents are unwilling to accept anything more than 5% of their portfolio principal. A typical market correction is traditionally defined as a stock market decline of 10% or more. Since 1950 the US stock market has averaged an annual decline of approximately 14. 2% each and every year. (Source: JPMorgan Guide to the Markets)
Folks if you are concerned about these types of fluctuations then you will need to seriously evaluate how much equity you have in the portfolio. There are a large amount of stocks that move more than that in just a few trading days. Additionally if you have a large allocation to bonds, you may see similar declines when and if interest rates start to rise. These scenarios set investors up for inefficient portfolio allocations and performance return expectations. Risk and reward are directly related. More risk can sometimes offer more reward, but this is not always the case, and of course nothing is a guarantee. Sometimes you take more risk owning a large amount of stocks and instead of getting more return your suffer large losses. That is the "risk" part. To conclude, what is your Acceptable Loss number. And does your current strategy align with that number realistically....? 3/1/2017 Market Turns 21
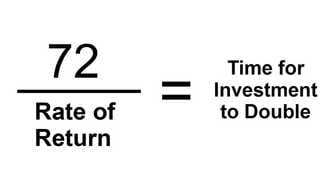
1/16/2017 What's your Number?There is nothing like a good nights sleep on a mattress that fits your style. Each person has a unique preference, firm or soft, warm or cool, or large vs small size mattress, that they prefer for the optimal comfort. But the title of the post is not referring to the Sleep Mattresses Number beds. Its referring to that thing that may keep you up at night: retirement income planning. Even after being in the wealth management industry for over 17 years, I am still amazed how many people I see that are completely unprepared for future retirement income needs. In fact, a recent study by Bank of America showed “Eighty-one percent of Americans said they don't know how much money they'll need to fund their golden years.” While I understand that this type of planning isn't the most exciting thing for most people, it is certainly one of the most impact full exercises one can do. There are thousands of financial professionals that are available to help. While some are better than others, finding a good financial planner or retirement income specialist is worth their weight in gold (or pillow feathers...) . 81% of Americans said they didn't know how much money they'll need to fund their golden years" Using something as simple as an online calculator to determine how much you will need to save and make a few assumptions on investment returns is an easy place to start. From there you will need to factor in important things like Social Security benefits, pension incomes, real estate or rental property income and required minimum distributions (RMD) from IRA accounts. From there investors need to make longevity assumptions, along with tax and inflation implications on future needs. No wonder most people would rather take a nap on a comfortable bed then try and calculate all of this alone. If you are one of the 81% that hasn't calculated your "number" then now is a good time to evaluate your current savings rate, projected investment return and future income needs with a qualified financial professional. By doing so, you will know where you stand and have a tangible action plan so you can sleep comfortably dreaming about your worry free retirement. 12/21/2016 Are you familiar with the rule of 72? The investment world if filled with "rules of thumbs" and other axioms to attempt to make complex issues easier to understand. One such rule is the one that most investors are familiar that is know as the “Rule of 72,”. This rule is a simple formula for figuring out the approximating the time it takes an investment to double at a given compounded annual return. The rule states that dividing the number 72 by the annual return equals the number of years it take to double. Simple example would be if you take 10% a year return it would take your money 7.2 years to double (72/10%). The significance of this rule is that it really demonstrates the true power of compounding. Imaging if you are 40 years old (as I am as I pen this article), and have a 25 year time frames until you plan on taking income from your retirement plan. Lets assume the starting value of your 401k is $250,000. Using the above formula and an estimated 7.2% annual return your money would double two and a half times. (72/7.2% =10years to double). Ten years divided into the estimated 25 year time horizon until withdrawals equals 2.5x your money. That is $625,000! Keep in mind this example doesn't include inflation or taxes, but it also doesn't include any future contributions. While the "rule of 72" is not a guarantee or a replacement for a well calculated financial plan it can provide some perspective of what is possible as you progress towards your goals. Too often investors get bogged down thinking they need to beat the market or some benchmark index, or take more risk then is necessary. When in reality generating something a simple as a solid single digit return that is compounded over a full market cycle (up and down markets) is what really counts. The election is now behind us. As we look forward it could be argued that there may be more uncertainty than clarity regarding president elect Trumps overall effects on the economy and markets . Here are a few interesting statistics to provide some "macro" (ie high level) insights on what has happened historically in an election year: The S&P 500 Index has mostly risen in presidential election years (source: BTN Research) In fact, 16 of the past 18 presidential election years have produced a positive return for the S&P 500 Index. The only down election years for the S&P500 dating back to 1944 have been 2000(dot-com) and 2008 (housing collapse) . Along with the fiscal policy, interest rates have a major effect on stock and bond market prices. in the past 50 years Federal Reserve has either cut or raised short term rates in EVERY presidential election year except for the last one in 2012. Whether is will happen in 2016 is to be determined, with only one meeting left in 2016 and consensus split on potential rate hike. One final thought is the return statistics for the stock market in the first year of a new president. Since 1931 the average return of the S&P 500 in the first year of a presidential term (new or incumbent) is 7.9%. During Obama's first term first year (2009) the return was 26.5%, second term, first year (2013) was 32.4%.
2017 will certainly be interesting that may bring a lot of change but based on historical precedence, their is reason to be optimistic. |
by Tim Dyer
Let us know what you would like to learn more about and we will review it! Archives
September 2017
Categories |
Dyer Wealth Management
|
Company |
Support
|
This website is solely for informational purposes. Dyer Wealth Management provides advisory services through Sage Capital Advisors, LLC., an SEC Registered Investment Adviser. Advisory services are only offered to clients or prospective clients where representatives of Dyer Wealth Management are properly licensed or exempt from licensure. No advice may be rendered unless a client service agreement is in place. Past performance is no guarantee of future returns. Investing involves risk and possible loss of principal capital. ”
* J. Timothy Dyer provides insurance products and services including life insurance and annuities. Insurance transactions do not fall under the advisory services outlined in the Dyer Wealth Management investment management. Additionally insurance transactions are not affiliated with Sage Capital Advisors and may contain commissions paid to agent.
* J. Timothy Dyer provides insurance products and services including life insurance and annuities. Insurance transactions do not fall under the advisory services outlined in the Dyer Wealth Management investment management. Additionally insurance transactions are not affiliated with Sage Capital Advisors and may contain commissions paid to agent.
© COPYRIGHT 2019. ALL RIGHTS RESERVED.


 RSS Feed

9/14/2017
1 Comment